Projects & Visualizations

Excel Simulation Project

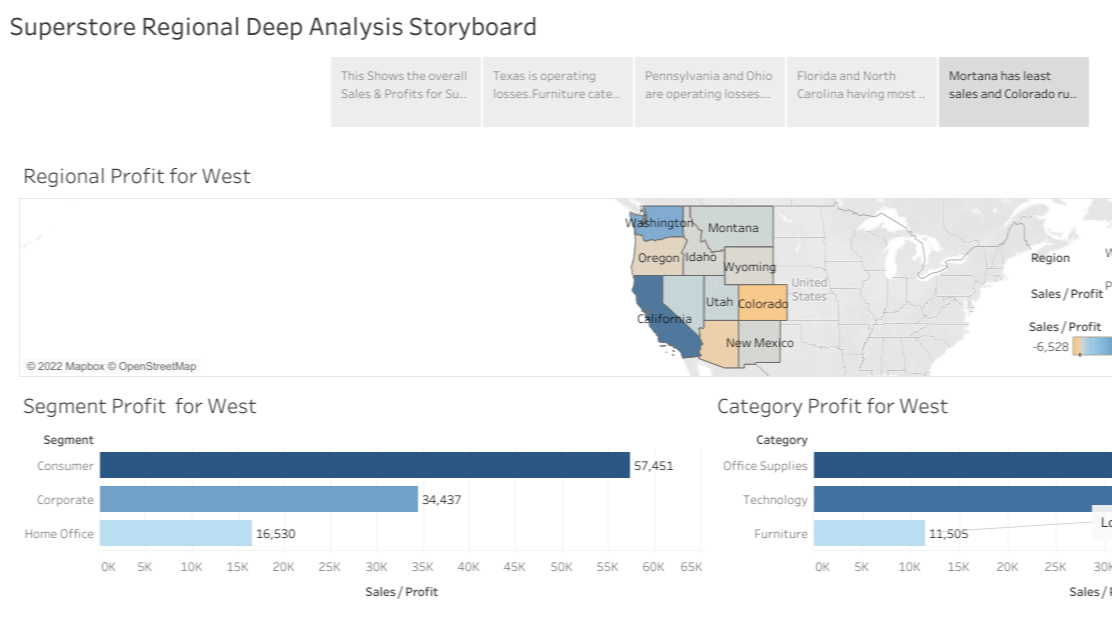
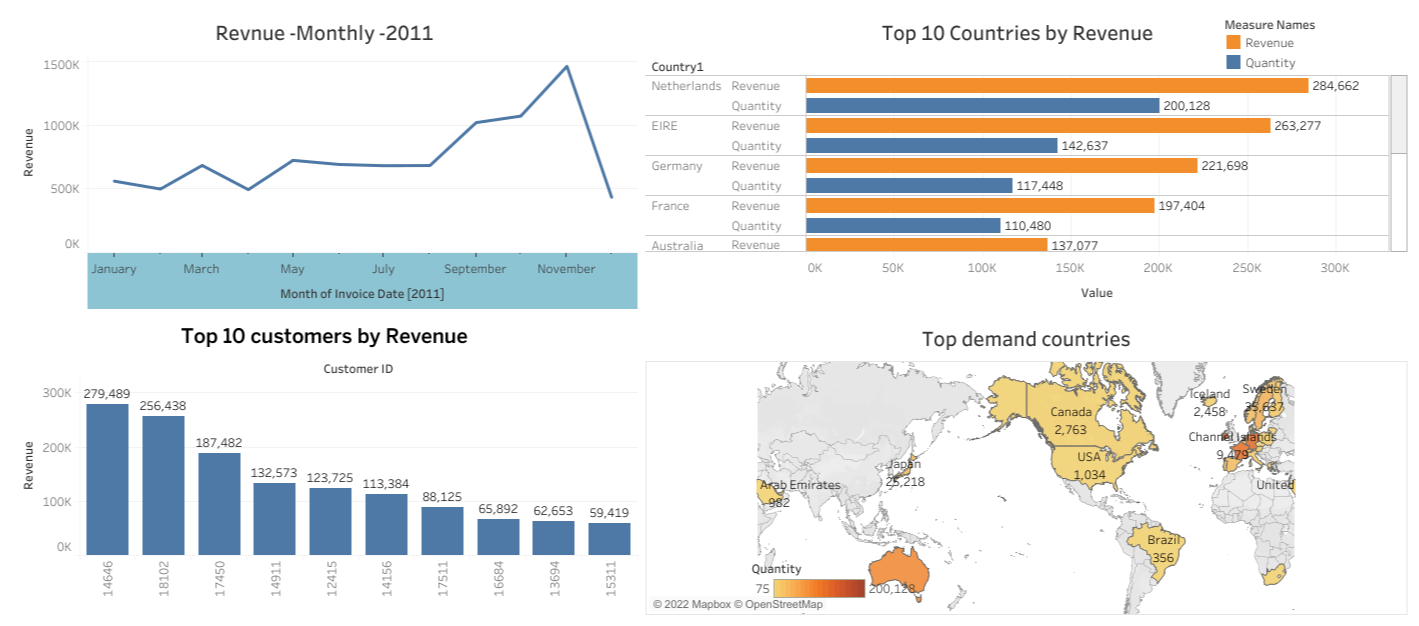
1. Data visualization using Tableau
(superstore data-set)
2. Building Stories using Tableau
Data Structures, Reading data files, Sub-setting and modifying data-frames, Sorting, Aggregating, Visualizing patterns and Trends

1. Data Science Lifecycle, Problem definition
2. Exploratory Data Analysis
(NYC Taxi Trip Duration Prediction)

Problem Statement:
The NYC Taxi Company wants to predict the duration of each trip at the point when the trip starts.
Data Sources:
Trip Info
Traffic & Geographic info
Weather
Target variable: trip_duration - duration of the trip in seconds
Model: Linear Regression Algorithm.
Training Mean Absolute Error: 0.01439020
Test Mean Absolute Error: 0.01437479578

Problem Statement
Over the last few years, the Client has captured several health demographic and lifestyle details about its patients. This includes details such as age and gender, along with several health parameters (e.g. hypertension, body mass index) and lifestyle-related variables (e.g. smoking status, occupation type). The Client wants to predict the probability of stroke happening to their patients. This will help doctors take proactive health measures for these patients.
Feature selection: using SelectKBest and F_Classif.
Model: Logistic Regression with manual class weights, since the dataset is imbalanced
Later tuned this model tuned by selecting variables with a high coefficient > 0.3
Age, Hypertension, heart disease, Avg glucose level, and age category are the features obtained
Final Model : Ridge Regression with C = 0.001
StratifiedKFold with CrossValidation= 10
Roc_Auc = 0.82562800
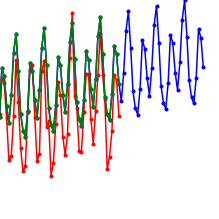
Forecasting Energy consumption
Optimize the Electricity energy generation so that it helps in comprehensive planning, operation, management, cascade utilization of energy systems and to promote the energy market.
Business objective:
Forecaste the Electricity energy consumption demand for the coming months using historical data of monthly electricity consumption
Forecast duration: Next 3 years
Solution:
Holt's Winters (Triple exponential smoothing) is used
The RMSE value for Holt Winter Method is 6.3524724724093815
Monthly Energy consumption is Forecasted for 3 years.

Predict the customers that could show higher intent towards a recommended credit card
Inputs to the model:
Customer details (gender, age, region etc.)
Details of his/her relationship with the bank (Channel_Code,Vintage, Avg_Asset_Value etc.)
Target variable - Is_Lead (Lead_Prediction)
The evaluation metric for this Problem : Roc_Auc_score
PREDICTION MODEL:
XGBClassifier model
Mean CV Roc_Auc score is: 0.874
Interpretation:
Age have a role on Creditcard interest. As age increase, CreditcardInterest also increase.
Those customers with high 'Vinate_Age_ratio' will have more chance of conversion.
Customers who had availed earlier Credit_Products and those customers who are reluctant to answer had more chance for Lead conversion.
Salaried and Other occupation has more chance for leadConversion.

Exploring based basic image processing techniques.
{ Skimage library }

Problem Statement:
ABC is a car rental company based out of Bangalore. It rents cars for both in and out stations at affordable prices. The users can rent different types of cars like Sedans, Hatchbacks, SUVs and MUVs, Minivans and so on. In recent times, the demand for cars is on the rise. As a result, the company would like to tackle the problem of supply and demand. The ultimate goal of the company is to strike the balance between the supply and demand inorder to meet the user expectations.
The company has collected the details of each rental.
Based on the past data, the company would like to forecast the demand of car rentals on an hourly basis.
Evaluation metric :
The evaluation metric for this problem is RMSE score.

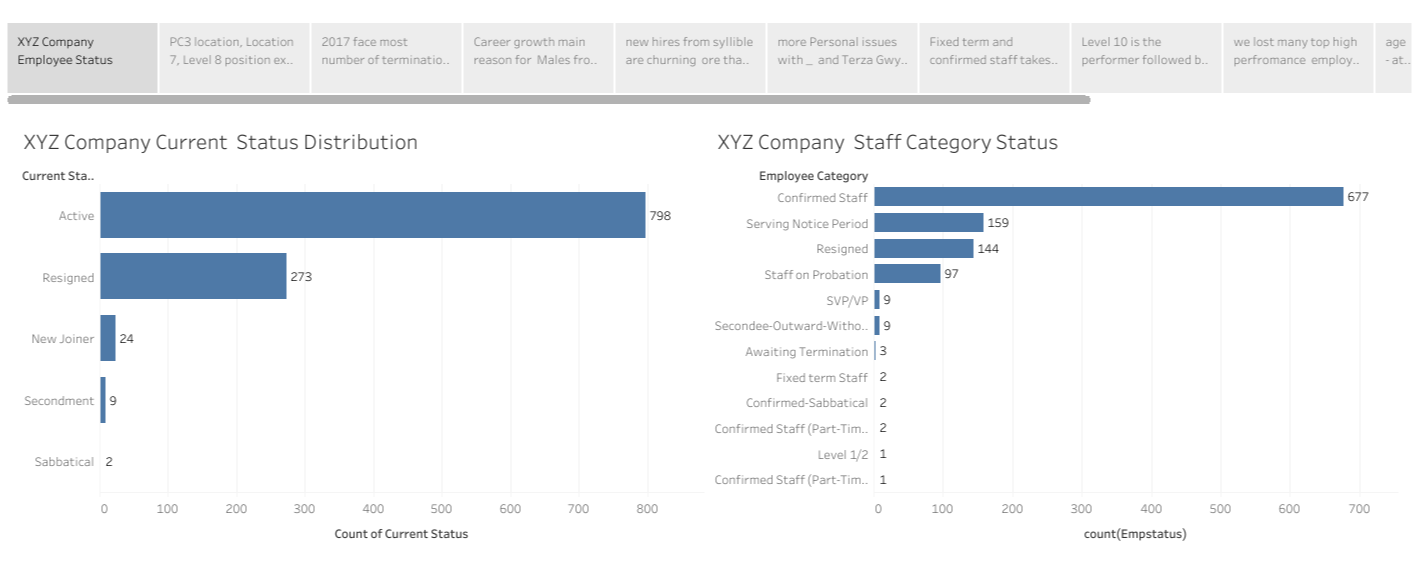
Employee Attrition Analytics { Capstone Project }
Build a data model to :
• Identify factors influencing attrition
• Predict possible attritions
• Identify possible ways to retain high performers
Implementation and Techniques:
The dataset contains information on the Employee Number, Employee Name, Profit centre, Position, Location, Category, Supervisor name, join date, Termination date if resigned, and current status of various Employees. It also contains monthly project details for 2 years.
The other file contains all the attrition in the organization for the years 2015-18 with details such as the reason for attrition along with other employee details.
The cleaned data were analyzed using EDA techniques and customer segmentation techniques (such as clustering) to implement the objectives. Feature Extraction of the high dimensional column was done using WOE scores.
Model:
A Probabilistic Classification approach such as Logistic Regression was used to identify the variable importance in determining employee attrition.
Model Evaluation:
We have selected AUC ROC Curve & f1 score as the evaluation criteria.
Optimal Cutoff - Using Youdens J statistic & Precision_Recall curve - 0.782603
Performance on test data
** Cross-validation results on TEST DATASET:**
The mean roc_auc_score Percentage for the TEST dataset is: 98.487
Mean f1_scores Percentage for TEST dataset is: 84.81
The model was interpreted based on factors identified as having a positive impact. Predicted the possible attritions, Recommendations, and Retention Measures were made for retaining high-performance employees
MovieLens 100K dataset has been a standard dataset used for benchmarking recommender systems for more than 20 years now and hence this provides a good point to start our learning journey for recommender systems. The data was collected through the MovieLens web site (movielens.umn.edu) during the seven-month period from September 19th, 1997 through April 22nd, 1998. This data has been cleaned up - users who had less than 20 ratings or did not have complete demographic information were removed from this data set.
Sérendipité is an article aggregation platform where articles from different domains such as technology, politics, news, and so on are shared by its users and then these articles are recommended on the basis of reading habits. They have a rating system for articles under which the users when they read the article rate it on a scale of 1 to 5.
In this project , I am using Movielens - 100K Dataset and Sérendipité dataset to explore various categories of Recommender Systems like
1. Non Personalised Recommender Systems
2. User Based Collaborative Filtering
3. Item Based Collaborative Filtering
4. Matrix Factorization Based Collaborative Filtering
5. Association Rule mining for a SuperMarket


Problem Statement
A supermarket store named Big Mart has opened a coffee shop inside the premises and after the launch it started seeing great traction and it was decided to have similar coffee shops at all the stores across the region for Big Mart.
Big Mart has been using association rules for its main retail stores and under the marketing plan for these coffee shops, they want to create similar association rules and do combo offers for these shops.
Transaction data for the coffee shop relating to 9000+ purchases was collected. The task is to find out the top association rules for the product team to create combo offers and use the insights to make the coffee shop even more profitable at all these stores.

Sérendipité is an article aggregation platform where articles from different domains such as technology, politics, news, and so on are shared by its users and then these articles are recommended on the basis of reading habits. They have a rating system for articles under which the users when they read the article rate it on a scale of 1 to 5.
We wish to explore the possibility of bringing personalized article recommendations to its customer base. We will figure out, what we can achieve with collaborative filtering by accurately predicting ratings for each user article combination
Trying all 3 techniques that we have learnt here and reporting which performs the best
User Based Collaborative Filtering using Surprise Library
Item Based Collaborative Filtering using Surprise Library
Matrix Factorization Based Collaborative Filtering


Building a Linear Regression model to predict the purchase amount of customer against various products to create personalized offer for customers against different products for a retail company.
The data set contains customer demographics (age, gender, marital status, city_type, stay_in_current_city), product details (product_id and product category) and Total purchase_amount from last month.
The Model was improved with Grid-Search CV and a Spark ML Pipeline was created for the final model.
End Result:
Train data :RMSE: 2644.495347 , r2: 0.722714
Validation data : 2671.235557742257